UNPACKING SKYPE USING THE DYNAMIC BINARY INSTRUMENTATION. PART 1
- * coverage of operators - whether each line of source code was made and tested;
- * coverage of conditions - whether each point of solution (computing true or false the expression) was completed and tested;
- * coverage of ways – whether all possible ways through a given part of the code were implemented and tested;
- * coverage of functions - whether each function of the program was carried out;
- * input/output coverage – whether all function calls and returns were carried out.
Intro
Today, Skype is one of the most popular proprietary software with closed source code that provides encrypted voice and video communications over the Internet between computers (VoIP) that use peer to peer technology (p2p) and paid services for calls to mobile and landline phones. As of 2011 Skype has 663 million users worldwide. Skype works on the principle of a black box. The program provides very cool features absolutely free and it makes you wonder about why creators of this program, which is freeware, do not disclose its source code and additionally use various protectors (code visualizers) and impede the analysis of the program through any media. It is quite understandable - free cheese is only in a mousetrap. In this article we will try to explore Skype in an extraordinary and newfangled way namely by means of a dynamic binary instrumentation.ANALYSIS OF THE SOFTWARE

WRITING AUTO-EXTRACTOR FOR SKYPE (MACOS X)
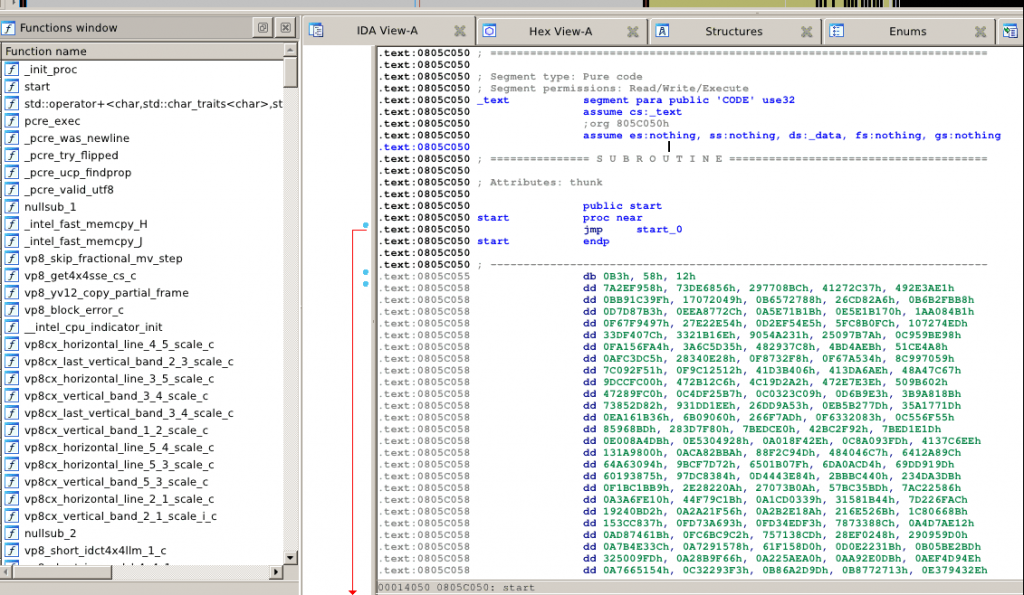
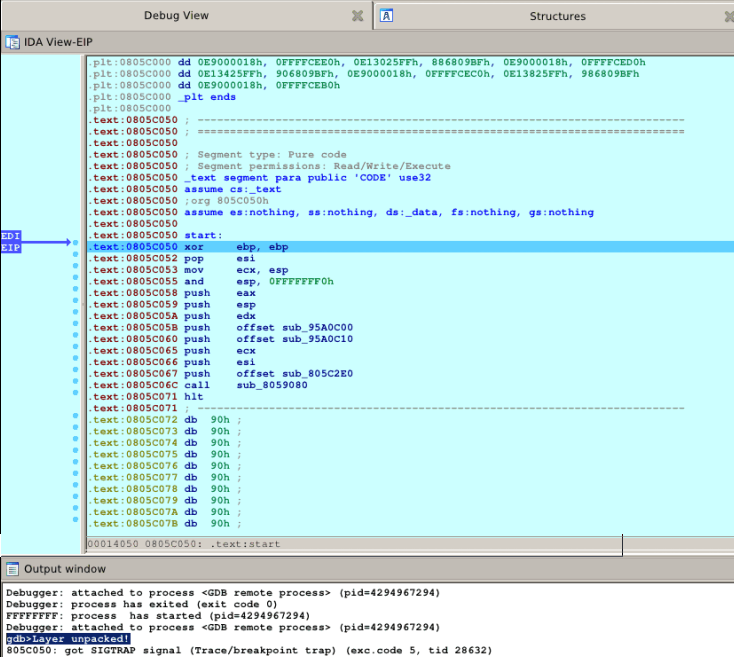
To assemble auto-extractor for Skype we have to collect some data for analysis. For these tasks interactive disassembler IDA is very suitable. For the analysis the free version is enough. Now go up the stairs. At the beginning our Skype binary file (executable file in format mach-o) should be opened in the disassembler and you have to wait until the auto analysis is finished. Here's the code before unpacking which was analyzed using IDA Free: Now you should put the hardware breakpoint to the entry point of executable file. Next run the program and finally when trying to enter into the entry point for the second time our hardware breakpoint will be actuated. But, as noted earlier, to study the use of a dynamic binary instrumentation during analysis we will use the Intel PIN Toolkit. Let’s write simplest Skype code extractor that will connect to the IDA analyzer (disassembler) via server GDB (debugger). But this construction may also be used for writing other extractors of code because the base is the same.Intel PIN
PIN Toolkit - framework developed by Intel Corporation to facilitate and automatethe labor associated with the instrumentalization and analysis the binary code coverage. Framework is written for x86 and x86_64 platforms and allows you to instrument any application code written for the architecture of these processors. In the past, Intel PIN supported and other platforms such as ARM / Itanium / IIRC. For very obvious reasons, the current platforms are no longer supported. The essence of the code instrumentation is to analyze the code coverage during the execution of the task program. In turn, code coverage - a measure that used to test and analyze software. It also shows the percentage of how the source code was tested. This technique of code coverage was one of the first techniques invented for systematic testing and analysis of software. Code coverage for the first time mentioned in 1963. There are severaldifferent ways to measure the coverage. The main ones:For programs with special security requirements often need arises to demonstrate that the tests give result 100% coverage for one of the criteria.
Some of this coverage criteria related to each other, for example, coverage of ways includes coverage of conditions and coverage of operators. Structural PIN can be divided into the main application (pin) that introduced into the context of the parsed process, core (pinvm.so) and tool module, developed by the user (it is also embedded in the context of the parsed process). Tool module is dynamically extensible library that uses the API provided core of PIN. The essence of operations with the API is to register the handlers that core will call during the execution the application that is analyzed or to log the information related to the process execution of the program or to change logic of the execution of application code in any way that the developer of tool module sees fit. Here is example of the code, which was taken from the samples that is in the archive with this framework.
// Quantitative example instrumentalization of the code
// Actual code for the instrumentalization
//
VOID docount() { icount++; }
// Code that checks need for instrumentalization of the code at a certain point
VOID Instruction(INS ins, VOID *v)
{
// Insert a call instruction PIN before each instruction that is executed
INS_InsertCall(ins, IPOINT_BEFORE, (AFUNPTR)docount, IARG_END);
}
void Usage(void)
{
...
}
// Initialization of the PIN Toolkit components
int main(int argc, char * argv[])
{
// // Initialization of the PIN
if (PIN_Init(argc, argv)) return Usage();
// Register instruction "Instruction" sets the level of instructions instrumentation
INS_AddInstrumentFunction(Instruction, 0);
// Running the program (without the possibility of returning)
PIN_StartProgram();
return 0;
}
In the main() procedure we initialize the internal PIN functions: set the level of instrumentation INS_AddInstrumentFunction() and run the program for execution PIN_StartProgram(). For each subsequent instruction of the program which is analyzed by PIN framework calls callback "Instruction" (marked INS_AddInstrumentFunction ()). In this callback we decide what instructions we want to select at the current moment by calling INS_InsertCall() function. Then this call is executed before the command is executed to return callback "docount". Actually this is a working example how to count the number of executed instructions in the program.
To be continued ...


